UNITED STATES
SECURITIES AND EXCHANGE COMMISSION
WASHINGTON, D.C. 20549
_________________________________________________________
FORM 8-K
_________________________________________________________
CURRENT REPORT
PURSUANT TO SECTION 13 OR 15(d) OF
THE SECURITIES EXCHANGE ACT OF 1934
Date of report (Date of earliest event reported): April 30, 2025
_________________________________________________________
(Exact Name of Registrant as Specified in Charter)
_________________________________________________________
| (State or Other Jurisdiction of Incorporation) | (Commission File Number) | (IRS Employer Identification No.) | ||||||
| (Address of Principal Executive Offices) | (Zip Code) | ||||
Registrant’s telephone number, including area code: (240 ) 744-1000
_________________________________________________________
Check the appropriate box below if the Form 8-K filing is intended to simultaneously satisfy the filing obligation of the registrant under any of the following provisions:
| Written communications pursuant to Rule 425 under the Securities Act (17 CFR 230.425) | |||||
| Soliciting material pursuant to Rule 14a-12 under the Exchange Act (17 CFR 240.14a-12) | |||||
| Pre-commencement communications pursuant to Rule 14d-2(b) under the Exchange Act (17 CFR 240.14d-2(b)) | |||||
| Pre-commencement communications pursuant to Rule 13e-4(c) under the Exchange Act (17 CFR 240.13e-4(c)) | |||||
Securities registered pursuant to Section 12(b) of the Act:
| Title of Each Class | Trading Symbol | Name of Each Exchange on Which Registered | ||||||||||||
Indicate by check mark whether the registrant is an emerging growth company as defined in Rule 405 of the Securities Act of 1933 (§230.405 of this chapter) or Rule 12b-2 of the Securities Exchange Act of 1934 (§240.12b-2 of this chapter).
Emerging growth company o
If an emerging growth company, indicate by check mark if the registrant has elected not to use the extended transition period for complying with any new or revised financial accounting standards provided pursuant to Section 13(a) of the Exchange Act. o
Item 2.02. Results of Operations and Financial Condition.
On April 30, 2025, Host Hotels & Resorts, Inc. issued a press release announcing its financial results for the first quarter ended March 31, 2025. The press release referred to supplemental financial information for the quarter that is available on the Company’s website at www.hosthotels.com. A copy of the press release and the supplemental financial information are furnished as Exhibit 99.1 and Exhibit 99.2, respectively, to this Report.
The information in this Report, including the exhibits, is provided under Item 2.02 of Form 8-K and shall not be deemed “filed” for the purposes of Section 18 of the Securities Exchange Act of 1934 or otherwise subject to the liabilities of that section. Furthermore, the information in this Report, including the exhibits, shall not be deemed to be incorporated by reference into the filings of the registrant under the Securities Act of 1933 regardless of any general incorporation language in such filings.
Item 9.01. Financial Statements and Exhibits
(d)Exhibits
| Exhibit No. | Description | ||||
| 99.1 | |||||
| 99.2 | |||||
| 104 | Cover Page Interactive Data File (embedded within the Inline XBRL document). | ||||
SIGNATURES
Pursuant to the requirements of the Securities Exchange Act of 1934, the registrant has duly caused this report to be signed on its behalf by the undersigned, hereunto duly authorized.
| HOST HOTELS & RESORTS, INC. | ||||||||
Date: April 30, 2025 | By: | /S/ JOSEPH C. OTTINGER | ||||||
| Name: | Joseph C. Ottinger | |||||||
| Title: | Senior Vice President and Corporate Controller | |||||||
 | Exhibit 99.1 | |||||||
SOURAV GHOSH Chief Financial Officer (240) 744-5267 | JAIME MARCUS Investor Relations (240) 744-5117 ir@hosthotels.com | |||||||
Host Hotels & Resorts, Inc. Reports Results for the First Quarter 2025
Comparable Hotel RevPAR Growth of 7.0% and Comparable Hotel Total RevPAR Growth of 5.8%
BETHESDA, Md; April 30, 2025 – Host Hotels & Resorts, Inc. (NASDAQ: HST) (the “Company”), the nation’s largest lodging real estate investment trust (“REIT”), today announced results for first quarter of 2025.
OPERATING RESULTS
(unaudited, in millions, except per share and hotel statistics)
| Quarter ended March 31, | |||||||||||||||||
| 2025 | 2024 | Percent Change | |||||||||||||||
| Revenues | $ | 1,594 | $ | 1,471 | 8.4 | % | |||||||||||
Comparable hotel revenues⁽¹⁾ | 1,583 | 1,512 | 4.7 | % | |||||||||||||
Comparable hotel Total RevPAR⁽¹⁾ | 408.57 | 386.06 | 5.8 | % | |||||||||||||
Comparable hotel RevPAR⁽¹⁾ | 240.18 | 224.52 | 7.0 | % | |||||||||||||
| Net income | $ | 251 | $ | 272 | (7.7 | %) | |||||||||||
EBITDAre⁽¹⁾ | 508 | 504 | 0.8 | % | |||||||||||||
Adjusted EBITDAre⁽¹⁾ | 514 | 489 | 5.1 | % | |||||||||||||
| Diluted earnings per common share | $ | 0.35 | $ | 0.38 | (7.9 | %) | |||||||||||
NAREIT FFO per diluted share⁽¹⁾ | 0.63 | 0.60 | 5.0 | % | |||||||||||||
Adjusted FFO per diluted share⁽¹⁾ | 0.64 | 0.61 | 4.9 | % | |||||||||||||
*Additional detail on the Company’s results, including data for 24 domestic markets, is available in the First Quarter 2025 Supplemental Financial Information on the Company’s website at www.hosthotels.com.
James F. Risoleo, President and Chief Executive Officer, said, “Host delivered comparable hotel RevPAR growth of 7.0% over the first quarter of 2024 as a result of higher rates, improving leisure transient trends in Maui and strong group demand. Comparable hotel Total RevPAR increased 5.8% over the same period last year, and improvements were led by group banquet and catering business."
Risoleo continued, “Despite the recent heightened macroeconomic uncertainty, we are maintaining our 2025 comparable hotel RevPAR growth guidance range of 0.5% to 2.5% over 2024. We are slightly reducing our comparable hotel Total RevPAR growth guidance range to 0.7% to 2.7% over 2024, driven by moderating group lead volume. We continue to believe Host's investment grade balance sheet, ample liquidity, and continued reinvestment in our portfolio uniquely position the Company to successfully navigate the current environment and take advantage of any potential opportunities.”
_______________________________
(1)NAREIT Funds From Operations (“FFO”) per diluted share, Adjusted FFO per diluted share, EBITDAre, Adjusted EBITDAre and comparable hotel revenues are non-GAAP (U.S. generally accepted accounting principles) financial measures within the meaning of the rules of the Securities and Exchange Commission (“SEC”). See the Notes to Financial Information on why the Company believes these supplemental measures are useful, reconciliations to the most directly comparable GAAP measure, and the limitations on the use of these supplemental measures. Additionally, comparable hotel results and statistics include adjustments for dispositions, acquisitions and non-comparable hotels. See Hotel Operating Data for RevPAR results of the portfolio based on the Company's ownership period without these adjustments.
| HOST HOTELS & RESORTS, INC. NEWS RELEASE | April 30, 2025 | ||||
HIGHLIGHTS:
•Comparable hotel Total RevPAR was $408.57, representing an increase of 5.8% compared to the first quarter of 2024, due primarily to improvements in room revenues coupled with increases in food & beverage revenues driven by group business.
•Comparable hotel RevPAR was $240.18 for the first quarter of 2025, representing an increase of 7.0% over the first quarter of 2024, driven primarily by an increase in room rates. This reflected strong performance in particular markets, such as Washington, D.C., New York and New Orleans, as well as an improving recovery in Maui.
•GAAP net income was $251 million, a 7.7% decrease compared to the first quarter of 2024, affected by an increase in interest expense and reflecting GAAP operating profit margin of 17.9%, a decline of 190 basis points compared to the first quarter of 2024, primarily due to a $21 million decrease in net gain on insurance settlements.
•Comparable hotel EBITDA was $504 million for the first quarter of 2025, an increase of 5.8% compared to 2024, leading to a comparable hotel EBITDA margin improvement of 30 basis points to 31.8%. The increase for the quarter was driven by rate improvements, which were able to offset an increase in wage expenses.
•Adjusted EBITDAre was $514 million for the first quarter of 2025, an increase of 5.1% compared to first quarter 2024. Results benefited from the improved comparable hotel EBITDA margins.
•Sold two outparcels adjacent to The Phoenician and recognized a gain on sale of $4 million for both net income and Adjusted EBITDAre.
•On March 26, 2025, The Don CeSar began re-welcoming guests as part of a phased reopening following remediation and reconstruction of damages caused by Hurricanes Helene and Milton in 2024. The remaining amenities are expected to re-open in summer of 2025. The Company currently estimates the total property damage and remediation costs related to The Don CeSar to be approximately $100 million - $110 million. In the first quarter of 2025, the Company received approximately $20 million of insurance proceeds related to the hurricanes, of which $10 million was recognized as business interruption proceeds.
BALANCE SHEET
The Company maintains a robust balance sheet, with the following balances at March 31, 2025:
•Total assets of $12.9 billion.
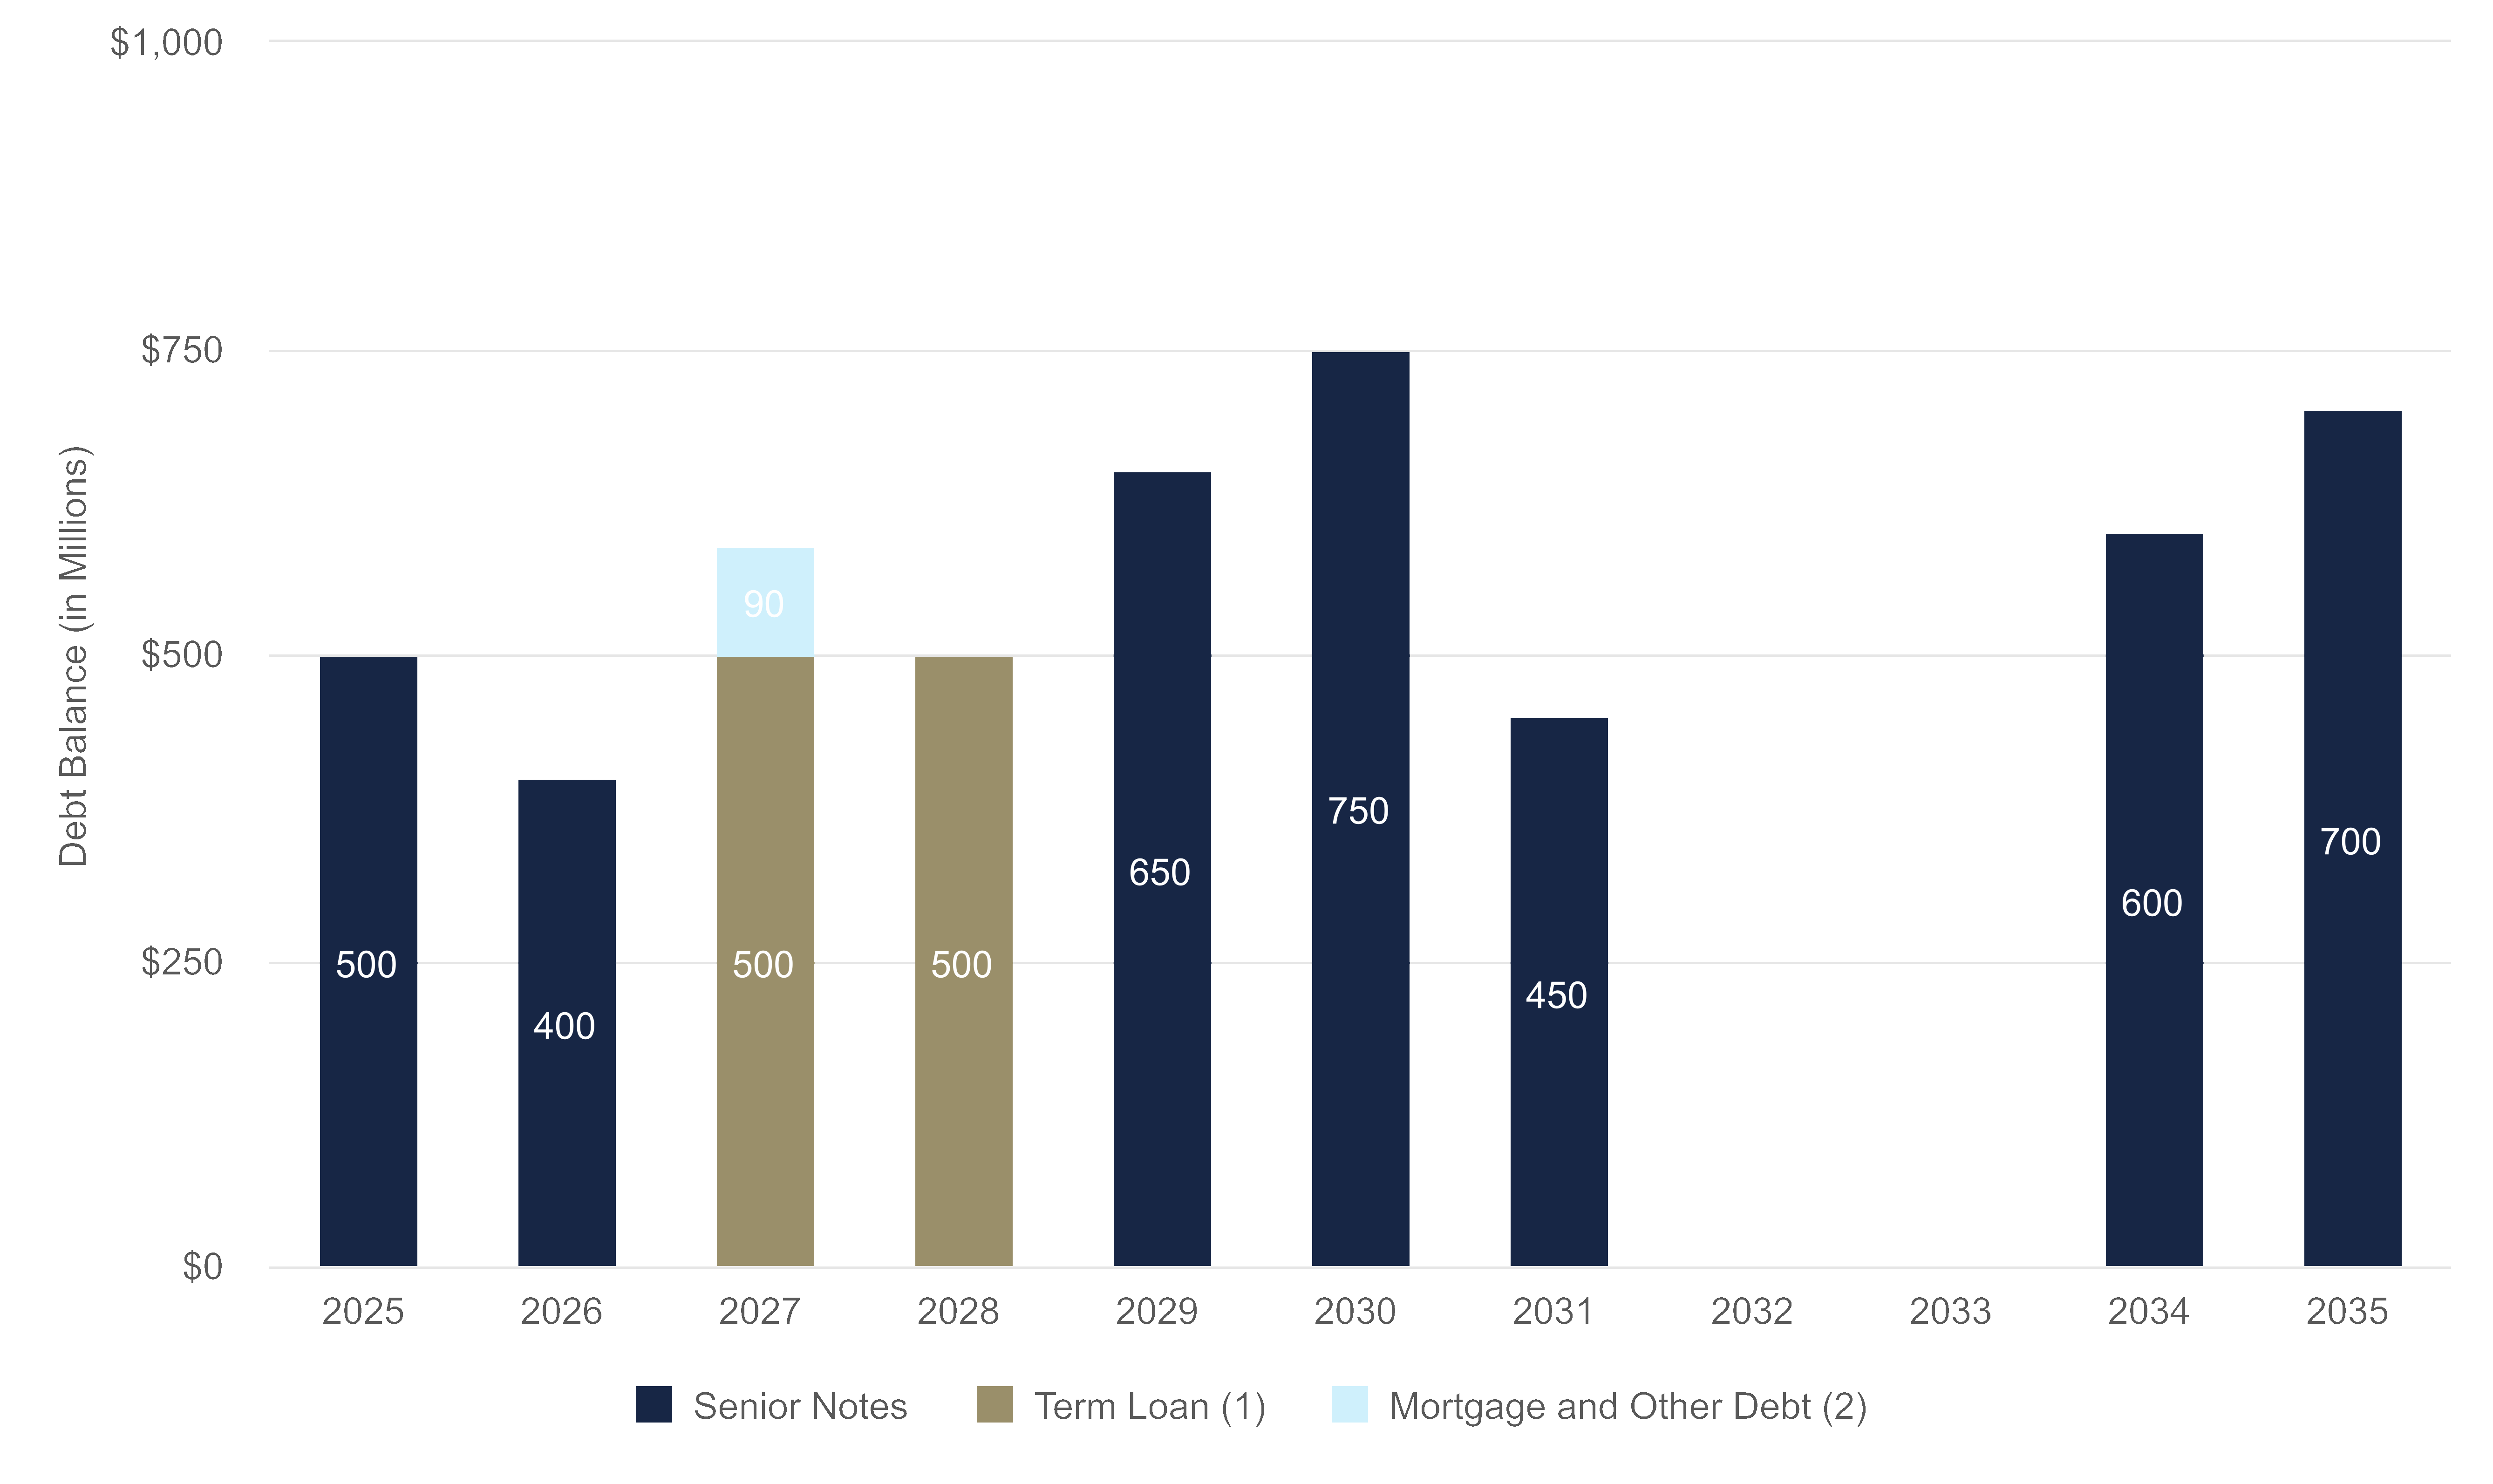
•Debt balance of $5.1 billion, with a weighted average maturity of 5.0 years, a weighted average interest rate of 4.7%, and a balanced maturity schedule.
•Total available liquidity of approximately $2.2 billion, including furniture, fixtures and equipment escrow reserves of $264 million and $1.5 billion available under the revolver portion of the credit facility.
SHARE REPURCHASES AND DIVIDENDS
During the first quarter of 2025, the Company repurchased 6.3 million shares of common stock at an average price of $15.79 per share, exclusive of commissions, through its common share repurchase program for a total of $100 million. The Company has approximately $585 million of remaining capacity under the repurchase program, pursuant to which its common stock may be purchased from time to time, depending upon market conditions.
The Company paid a first quarter common stock cash dividend of $0.20 per share on April 15, 2025 to stockholders of record on March 31, 2025. All future dividends are subject to approval by the Company’s Board of Directors.
HOTEL BUSINESS MIX UPDATE
The Company’s customers fall into three broad groups: transient, group and contract business, which accounted for approximately 60%, 36%, and 4%, respectively, of its full year 2024 room sales.
The following are the results for transient, group and contract business in comparison to 2024 performance, for the Company's current portfolio. Results reflect lower group in the first quarter of 2025 as compared to 2024 as the
Company's properties in Maui benefited from recovery and relief group business in first quarter of 2024:
PAGE 2 OF 20
| HOST HOTELS & RESORTS, INC. NEWS RELEASE | April 30, 2025 | ||||
| Quarter ended March 31, 2025 | |||||||||||||||||
| Transient | Group | Contract | |||||||||||||||
| Room nights (in thousands) | 1,362 | 1,136 | 193 | ||||||||||||||
| Percent change in room nights vs. same period in 2024 | (0.8 | %) | (0.6 | %) | 11.4 | % | |||||||||||
| Rooms revenues (in millions) | $ | 523 | $ | 365 | $ | 43 | |||||||||||
| Percent change in revenues vs. same period in 2024 | 4.7 | % | 5.9 | % | 20.5 | % | |||||||||||
CAPITAL EXPENDITURES
The following presents the Company’s capital expenditures spend through the first quarter of 2025 and the forecast for full year 2025 (in millions):
| Quarter ended March 31, 2025 | 2025 Full Year Forecast | ||||||||||||||||
| Actual | Low-end of range | High-end of range | |||||||||||||||
| ROI - Hyatt Transformational Capital Program | $ | 19 | $ | 170 | $ | 180 | |||||||||||
| All other return on investment ("ROI") projects | 27 | 100 | 135 | ||||||||||||||
| Total ROI Projects | 46 | 270 | 315 | ||||||||||||||
| Renewals and Replacements ("R&R") | 61 | 240 | 275 | ||||||||||||||
| R&R and ROI Capital expenditures | 107 | 510 | 590 | ||||||||||||||
| R&R - Property Damage Reconstruction | 39 | 70 | 80 | ||||||||||||||
| Total Capital Expenditures | $ | 146 | $ | 580 | $ | 670 | |||||||||||
Inventory spend for condo development(1) | 19 | 75 | 85 | ||||||||||||||
| Total capital allocation | $ | 165 | $ | 655 | $ | 755 | |||||||||||
__________
(1)Represents construction costs for the development of condominium units on a land parcel adjacent to Four Seasons Resort Orlando at Walt Disney World® Resort. Under GAAP, costs to develop units for resale are considered an operating activity on the statement of cash flows, and categorized as inventory. This spend is separate from payments for capital expenditures, which are considered investing activities.
Under the Hyatt Transformational Capital Program, the Company received $5 million in the first quarter of 2025, of the expected full year $27 million, of operating guarantees to offset business disruptions.
2025 OUTLOOK
Despite strong first quarter results and comparable hotel RevPAR growth, macroeconomic uncertainty has made providing guidance more difficult. The full year guidance range provided is based on information currently available, including moderating trends in group lead volume. The low end of the range contemplates a mild slowdown driven by deteriorating macroeconomic sentiment and a worsening international demand imbalance, resulting in a slight decline in the Company's RevPAR over the remaining three quarters. The high end of the range assumes a more stable macroeconomic environment, driven by clarity on trade policies and improvements in the international demand imbalance with minimal RevPAR growth for the remaining quarters of the year. Based on the current environment, the Company estimates that if comparable hotel RevPAR falls outside of this range, for every 100-basis point change in RevPAR, there would be an expected $32 million to $37 million change in both net income and Adjusted EBITDAre.
These scenarios both include an expected decline in operating profit margin and comparable hotel EBITDA margin due to growth in wages, real estate taxes and insurance, as well as a decrease in business interruption proceeds, as compared to 2024. The guidance ranges for net income and Adjusted EBITDAre also include an estimated $25 million contribution from sales at the condominium development adjacent to the Four Seasons Resort Orlando at Walt Disney® Resort. The guidance ranges for net income and Adjusted EBITDAre do not assume any additional gain from insurance receipts related to hurricanes Helene and Milton, as timing for the receipt of these proceeds remains uncertain.
PAGE 3 OF 20
| HOST HOTELS & RESORTS, INC. NEWS RELEASE | April 30, 2025 | ||||
The Company anticipates its 2025 operating results as compared to 2024 will be in the following range:
Current Full Year 2025 Guidance | Current Full Year 2025 Guidance Change vs. 2024 | Previous Full Year 2025 Guidance Change vs. 2024 | Change in Full Year 2025 Guidance to the Mid-Point | ||||||||||||||||||||
| Comparable hotel Total RevPAR | $366 to $374 | 0.7% to 2.7% | 1.0% to 3.0% | (30) bps | |||||||||||||||||||
| Comparable hotel RevPAR | $221 to $225 | 0.5% to 2.5% | 0.5% to 2.5% | 0 bps | |||||||||||||||||||
Total revenues under GAAP (in millions) | $5,987 to $6,104 | 5.3% to 7.4% | 5.5% to 7.4% | (10) bps | |||||||||||||||||||
| Operating profit margin under GAAP | 12.2% to 13.1% | (320) bps to (230) bps | (360) bps to (280) bps | 40 bps | |||||||||||||||||||
| Comparable hotel EBITDA margin | 27.7% to 28.3% | (160) bps to (100) bps | (210) bps to (150) bps | 50 bps | |||||||||||||||||||
Based upon the above parameters, the Company estimates its 2025 guidance as follows:
Current Full Year 2025 Guidance | Previous Full Year 2025 Guidance | Change in Full Year 2025 Guidance to the Mid-Point | |||||||||||||||
| Net income (in millions) | $512 to $581 | $486 to $546 | $30 | ||||||||||||||
| Adjusted EBITDAre (in millions) | $1,610 to $1,680 | $1,590 to $1,650 | $25 | ||||||||||||||
| Diluted earnings per common share | $0.72 to $0.82 | $0.68 to $0.77 | $0.05 | ||||||||||||||
| NAREIT FFO per diluted share | $1.84 to $1.94 | $1.79 to $1.87 | $0.06 | ||||||||||||||
| Adjusted FFO per diluted share | $1.88 to $1.97 | $1.82 to $1.91 | $0.06 | ||||||||||||||
See the 2025 Forecast Schedules and the Notes to Financial Information for items that may affect forecast results and the First Quarter 2025 Supplemental Financial Information for additional detail on the mid-point of full year 2025 guidance.
ABOUT HOST HOTELS & RESORTS
Host Hotels & Resorts, Inc. is an S&P 500 company and is the largest lodging real estate investment trust and one of the largest owners of luxury and upper-upscale hotels. The Company currently owns 76 properties in the United States and five properties internationally totaling approximately 43,400 rooms. The Company also holds non-controlling interests in seven domestic and one international joint ventures. Guided by a disciplined approach to capital allocation and aggressive asset management, the Company partners with premium brands such as Marriott®, Ritz-Carlton®, Westin®, Sheraton®, W®, St. Regis®, The Luxury Collection®, Hyatt®, Fairmont®, 1 Hotels®, Hilton®, Four Seasons®, Swissôtel®, ibis® and Novotel®, as well as independent brands. For additional information, please visit the Company’s website at www.hosthotels.com.
Note: This press release contains forward-looking statements within the meaning of federal securities regulations. These forward-looking statements include, but may not be limited to, our expectations regarding the recovery of travel and the lodging industry, the impact of the Maui wildfires and 2025 estimates with respect to our business, including our anticipated capital expenditures and financial and operating results. Forward-looking statements are not guarantees of future performance and involve known and unknown risks, uncertainties and other factors which may cause the actual results to differ materially from those anticipated at the time the forward-looking statements are made. These risks include, but are not limited to, those described in the Company’s annual report on Form 10-K and other filings with the SEC. Although the Company believes the expectations reflected in such forward-looking statements are based upon reasonable assumptions, it can give no assurance that the expectations will be attained or that any deviation will not be material. All information in this release is as of April 30, 2025, and the Company undertakes no obligation to update any forward-looking statement to conform the statement to actual results or changes in the Company’s expectations.
*This press release contains registered trademarks that are the exclusive property of their respective owners. None of the owners of these trademarks have any responsibility or liability for any information contained in this press release.
*** Tables to Follow ***
PAGE 4 OF 20
| HOST HOTELS & RESORTS, INC. NEWS RELEASE | April 30, 2025 | ||||
Host Hotels & Resorts, Inc., herein referred to as “we,” “Host Inc.,” or the “Company,” is a self-managed and self-administered real estate investment trust that owns hotel properties. We conduct our operations as an umbrella partnership REIT through an operating partnership, Host Hotels & Resorts, L.P. (“Host LP”), of which we are the sole general partner. When distinguishing between Host Inc. and Host LP, the primary difference is approximately 1% of the partnership interests in Host LP held by outside partners as of March 31, 2025, which are non-controlling interests in Host LP in our consolidated balance sheets and are included in net (income) loss attributable to non-controlling interests in our condensed consolidated statements of operations. Readers are encouraged to find further detail regarding our organizational structure in our annual report on Form 10-K.
2025 OPERATING RESULTS | PAGE NO. | ||||
March 31, 2025 and December 31, 2024 | |||||
Quarter ended March 31, 2025 and 2024 | |||||
Earnings per Common Share (unaudited) Quarter ended March 31, 2025 and 2024 | |||||
2025 FORECAST INFORMATION | |||||
Schedule of Comparable Hotel Results for Full Year 2025 Forecasts | |||||
PAGE 5 OF 20
HOST HOTELS & RESORTS, INC.
Condensed Consolidated Balance Sheets
(unaudited, in millions, except shares and per share amounts)
March 31, 2025 | December 31, 2024 | |||||||||||||
| ASSETS | ||||||||||||||
| Property and equipment, net | $ | 10,862 | $ | 10,906 | ||||||||||
| Right-of-use assets | 558 | 559 | ||||||||||||
| Due from managers | 116 | 36 | ||||||||||||
| Advances to and investments in affiliates | 203 | 166 | ||||||||||||
| Furniture, fixtures and equipment replacement fund | 264 | 242 | ||||||||||||
| Notes receivable | — | 79 | ||||||||||||
| Other | 516 | 506 | ||||||||||||
| Cash and cash equivalents | 428 | 554 | ||||||||||||
| Total assets | $ | 12,947 | $ | 13,048 | ||||||||||
| LIABILITIES, NON-CONTROLLING INTERESTS AND EQUITY | ||||||||||||||
| Debt⁽¹⁾ | ||||||||||||||
| Senior notes | $ | 3,995 | $ | 3,993 | ||||||||||
Credit facility, including the term loans of $998 | 993 | 992 | ||||||||||||
| Mortgage and other debt | 97 | 98 | ||||||||||||
| Total debt | 5,085 | 5,083 | ||||||||||||
| Lease liabilities | 559 | 560 | ||||||||||||
| Accounts payable and accrued expenses | 261 | 351 | ||||||||||||
| Due to managers | 34 | 54 | ||||||||||||
| Other | 222 | 223 | ||||||||||||
| Total liabilities | 6,161 | 6,271 | ||||||||||||
| Redeemable non-controlling interests - Host Hotels & Resorts, L.P. | 133 | 165 | ||||||||||||
| Host Hotels & Resorts, Inc. stockholders’ equity: | ||||||||||||||
Common stock, par value $0.01, 1,050 million shares authorized, 693.7 million shares and 699.1 million shares issued and outstanding, respectively | 7 | 7 | ||||||||||||
| Additional paid-in capital | 7,390 | 7,462 | ||||||||||||
| Accumulated other comprehensive loss | (79) | (83) | ||||||||||||
| Deficit | (668) | (777) | ||||||||||||
| Total equity of Host Hotels & Resorts, Inc. stockholders | 6,650 | 6,609 | ||||||||||||
| Non-redeemable non-controlling interests—other consolidated partnerships | 3 | 3 | ||||||||||||
| Total equity | 6,653 | 6,612 | ||||||||||||
| Total liabilities, non-controlling interests and equity | $ | 12,947 | $ | 13,048 | ||||||||||
__________
(1)Please see our First Quarter 2025 Supplemental Financial Information for more detail on our debt balances and financial covenant ratios under our credit facility and senior notes indentures.
PAGE 6 OF 20
HOST HOTELS & RESORTS, INC.
Condensed Consolidated Statements of Operations
(unaudited, in millions, except per share amounts)
| Quarter ended March 31, | ||||||||||||||
| 2025 | 2024 | |||||||||||||
| Revenues | ||||||||||||||
| Rooms | $ | 938 | $ | 853 | ||||||||||
| Food and beverage | 503 | 473 | ||||||||||||
| Other | 153 | 145 | ||||||||||||
| Total revenues | 1,594 | 1,471 | ||||||||||||
| Expenses | ||||||||||||||
| Rooms | 225 | 202 | ||||||||||||
| Food and beverage | 323 | 295 | ||||||||||||
| Other departmental and support expenses | 364 | 334 | ||||||||||||
| Management fees | 69 | 69 | ||||||||||||
| Other property-level expenses | 111 | 104 | ||||||||||||
| Depreciation and amortization | 196 | 180 | ||||||||||||
Corporate and other expenses⁽¹⁾ | 31 | 27 | ||||||||||||
| Net gain on insurance settlements | (10) | (31) | ||||||||||||
| Total operating costs and expenses | 1,309 | 1,180 | ||||||||||||
| Operating profit | 285 | 291 | ||||||||||||
| Interest income | 8 | 18 | ||||||||||||
| Interest expense | (57) | (47) | ||||||||||||
| Other gains | 4 | — | ||||||||||||
| Equity in earnings of affiliates | 10 | 8 | ||||||||||||
| Income before income taxes | 250 | 270 | ||||||||||||
| Benefit for income taxes | 1 | 2 | ||||||||||||
| Net income | 251 | 272 | ||||||||||||
| Less: Net income attributable to non-controlling interests | (3) | (4) | ||||||||||||
| Net income attributable to Host Inc. | $ | 248 | $ | 268 | ||||||||||
| Basic and diluted earnings per common share | $ | 0.35 | $ | 0.38 | ||||||||||
___________
(1)Corporate and other expenses include the following items:
| Quarter ended March 31, | ||||||||||||||
| 2025 | 2024 | |||||||||||||
| General and administrative costs | $ | 25 | $ | 21 | ||||||||||
| Non-cash stock-based compensation expense | 6 | 6 | ||||||||||||
| Total | $ | 31 | $ | 27 | ||||||||||
PAGE 7 OF 20
HOST HOTELS & RESORTS, INC.
Earnings per Common Share
(unaudited, in millions, except per share amounts)
| Quarter ended March 31, | ||||||||||||||
| 2025 | 2024 | |||||||||||||
| Net income | $ | 251 | $ | 272 | ||||||||||
| Less: Net income attributable to non-controlling interests | (3) | (4) | ||||||||||||
| Net income attributable to Host Inc. | $ | 248 | $ | 268 | ||||||||||
| Basic weighted average shares outstanding | 697.8 | 704.0 | ||||||||||||
| Assuming distribution of common shares granted under the comprehensive stock plans, less shares assumed purchased at market | 0.5 | 1.5 | ||||||||||||
| Diluted weighted average shares outstanding⁽¹⁾ | 698.3 | 705.5 | ||||||||||||
| Basic and diluted earnings per common share | $ | 0.35 | $ | 0.38 | ||||||||||
___________
(1)Dilutive securities may include shares granted under comprehensive stock plans, preferred operating partnership units (“OP Units”) held by non-controlling limited partners and other non-controlling interests that have the option to convert their limited partnership interests to common OP Units. No effect is shown for any securities that were anti-dilutive for the period.
PAGE 8 OF 20
HOST HOTELS & RESORTS, INC.
Hotel Operating Data for Consolidated Hotels
Comparable Hotel Results by Location(1)
As of March 31, 2025 | Quarter ended March 31, 2025 | Quarter ended March 31, 2024 | |||||||||||||||||||||||||||||||||||||||||||||||||||||||||||||||||||||
| Location | No. of Properties | No. of Rooms | Average Room Rate | Average Occupancy Percentage | RevPAR | Total RevPAR | Average Room Rate | Average Occupancy Percentage | RevPAR | Total RevPAR | Percent Change in RevPAR | Percent Change in Total RevPAR | |||||||||||||||||||||||||||||||||||||||||||||||||||||||||||
| Miami | 2 | 1,038 | $ | 652.77 | 84.1 | % | $ | 548.88 | $ | 921.13 | $ | 635.30 | 82.0 | % | $ | 520.71 | $ | 867.57 | 5.4 | % | 6.2 | % | |||||||||||||||||||||||||||||||||||||||||||||||||
| Florida Gulf Coast | 4 | 1,529 | 637.22 | 81.6 | % | 519.77 | 1,103.93 | 626.36 | 81.6 | % | 511.02 | 1,034.79 | 1.7 | % | 6.7 | % | |||||||||||||||||||||||||||||||||||||||||||||||||||||||
| Maui | 3 | 1,580 | 683.78 | 75.0 | % | 513.04 | 788.61 | 672.67 | 65.8 | % | 442.71 | 738.07 | 15.9 | % | 6.8 | % | |||||||||||||||||||||||||||||||||||||||||||||||||||||||
| Phoenix | 3 | 1,545 | 500.68 | 81.3 | % | 407.28 | 890.19 | 490.11 | 81.3 | % | 398.36 | 854.54 | 2.2 | % | 4.2 | % | |||||||||||||||||||||||||||||||||||||||||||||||||||||||
Oahu (2) | 2 | 876 | 483.66 | 83.8 | % | 405.20 | 625.53 | 436.64 | 82.0 | % | 358.07 | 571.45 | 13.2 | % | 9.5 | % | |||||||||||||||||||||||||||||||||||||||||||||||||||||||
| Jacksonville | 1 | 446 | 524.64 | 68.0 | % | 356.95 | 828.70 | 528.66 | 64.6 | % | 341.31 | 774.19 | 4.6 | % | 7.0 | % | |||||||||||||||||||||||||||||||||||||||||||||||||||||||
| Orlando | 2 | 2,448 | 435.81 | 73.3 | % | 319.65 | 660.15 | 407.08 | 74.2 | % | 302.14 | 637.59 | 5.8 | % | 3.5 | % | |||||||||||||||||||||||||||||||||||||||||||||||||||||||
| Nashville | 2 | 721 | 324.92 | 80.4 | % | 261.13 | 451.22 | 310.63 | 73.8 | % | 229.37 | 386.44 | 13.9 | % | 16.8 | % | |||||||||||||||||||||||||||||||||||||||||||||||||||||||
| New York | 3 | 2,720 | 327.97 | 79.0 | % | 258.99 | 382.34 | 307.03 | 74.1 | % | 227.59 | 335.44 | 13.8 | % | 14.0 | % | |||||||||||||||||||||||||||||||||||||||||||||||||||||||
| Los Angeles/Orange County | 3 | 1,067 | 311.12 | 79.2 | % | 246.38 | 368.36 | 299.02 | 74.8 | % | 223.80 | 334.70 | 10.1 | % | 10.1 | % | |||||||||||||||||||||||||||||||||||||||||||||||||||||||
| Washington, D.C. (CBD) | 5 | 3,245 | 328.11 | 68.0 | % | 223.24 | 322.78 | 275.83 | 66.9 | % | 184.43 | 270.75 | 21.0 | % | 19.2 | % | |||||||||||||||||||||||||||||||||||||||||||||||||||||||
| San Diego | 3 | 3,294 | 301.96 | 72.7 | % | 219.60 | 433.52 | 294.27 | 77.4 | % | 227.67 | 452.71 | (3.5 | %) | (4.2 | %) | |||||||||||||||||||||||||||||||||||||||||||||||||||||||
| San Francisco/San Jose | 6 | 4,162 | 300.24 | 63.6 | % | 191.05 | 285.73 | 290.06 | 64.0 | % | 185.67 | 280.40 | 2.9 | % | 1.9 | % | |||||||||||||||||||||||||||||||||||||||||||||||||||||||
| New Orleans | 1 | 1,333 | 256.20 | 71.4 | % | 182.91 | 278.00 | 211.33 | 74.6 | % | 157.65 | 253.56 | 16.0 | % | 9.6 | % | |||||||||||||||||||||||||||||||||||||||||||||||||||||||
| Austin | 2 | 767 | 267.21 | 67.4 | % | 180.05 | 324.90 | 276.13 | 64.7 | % | 178.72 | 323.83 | 0.7 | % | 0.3 | % | |||||||||||||||||||||||||||||||||||||||||||||||||||||||
| Northern Virginia | 2 | 916 | 271.39 | 65.4 | % | 177.61 | 289.32 | 244.11 | 67.8 | % | 165.55 | 265.89 | 7.3 | % | 8.8 | % | |||||||||||||||||||||||||||||||||||||||||||||||||||||||
| Philadelphia | 2 | 810 | 217.69 | 76.8 | % | 167.08 | 260.44 | 202.76 | 72.8 | % | 147.59 | 228.90 | 13.2 | % | 13.8 | % | |||||||||||||||||||||||||||||||||||||||||||||||||||||||
| Houston | 5 | 1,942 | 232.08 | 71.7 | % | 166.43 | 238.70 | 223.14 | 74.6 | % | 166.45 | 231.31 | — | % | 3.2 | % | |||||||||||||||||||||||||||||||||||||||||||||||||||||||
| Boston | 2 | 1,496 | 235.02 | 64.9 | % | 152.52 | 223.00 | 224.11 | 67.9 | % | 152.09 | 221.78 | 0.3 | % | 0.6 | % | |||||||||||||||||||||||||||||||||||||||||||||||||||||||
| San Antonio | 2 | 1,512 | 229.79 | 66.3 | % | 152.40 | 252.38 | 229.52 | 66.1 | % | 151.75 | 252.73 | 0.4 | % | (0.1 | %) | |||||||||||||||||||||||||||||||||||||||||||||||||||||||
| Atlanta | 2 | 810 | 222.74 | 67.3 | % | 149.83 | 256.93 | 213.56 | 61.6 | % | 131.66 | 227.78 | 13.8 | % | 12.8 | % | |||||||||||||||||||||||||||||||||||||||||||||||||||||||
| Seattle | 2 | 1,315 | 212.06 | 54.7 | % | 116.05 | 159.55 | 210.91 | 52.7 | % | 111.05 | 162.48 | 4.5 | % | (1.8 | %) | |||||||||||||||||||||||||||||||||||||||||||||||||||||||
| Denver | 3 | 1,342 | 183.68 | 55.6 | % | 102.11 | 159.71 | 177.37 | 55.3 | % | 98.05 | 159.53 | 4.1 | % | 0.1 | % | |||||||||||||||||||||||||||||||||||||||||||||||||||||||
| Chicago | 3 | 1,562 | 186.39 | 53.0 | % | 98.78 | 147.67 | 179.25 | 55.7 | % | 99.76 | 145.54 | (1.0 | %) | 1.5 | % | |||||||||||||||||||||||||||||||||||||||||||||||||||||||
| Other | 9 | 3,007 | 346.28 | 60.5 | % | 209.34 | 325.66 | 326.67 | 58.0 | % | 189.42 | 295.98 | 10.5 | % | 10.0 | % | |||||||||||||||||||||||||||||||||||||||||||||||||||||||
| Domestic | 74 | 41,483 | 351.34 | 69.7 | % | 245.06 | 418.32 | 331.61 | 69.1 | % | 229.10 | 394.91 | 7.0 | % | 5.9 | % | |||||||||||||||||||||||||||||||||||||||||||||||||||||||
| International | 5 | 1,499 | 172.01 | 61.0 | % | 104.88 | 136.91 | 173.64 | 56.1 | % | 97.47 | 139.44 | 7.6 | % | (1.8 | %) | |||||||||||||||||||||||||||||||||||||||||||||||||||||||
| All Locations | 79 | 42,982 | $ | 345.86 | 69.4 | % | $ | 240.18 | $ | 408.57 | $ | 327.11 | 68.6 | % | $ | 224.52 | $ | 386.06 | 7.0 | % | 5.8 | % | |||||||||||||||||||||||||||||||||||||||||||||||||
___________
(1)See the Notes to Financial Information for a discussion of comparable hotel operating statistics. CBD of a location refers to the central business district. Hotel RevPAR is calculated as room revenues divided by the available room nights. Hotel Total RevPAR is calculated by dividing the sum of rooms, food and beverage and other revenues by the available room nights.
(2)Prior to our ownership of The Ritz Carlton O'ahu, Turtle Bay, golf revenues were recorded by the property based on gross sales. After our acquisition of the property in July 2024, the golf course operates under a lease agreement, under which we record rental income, resulting in lower total revenues when compared to the periods prior to our ownership.
PAGE 9 OF 20
HOST HOTELS & RESORTS, INC.
Hotel Operating Data for Consolidated Hotels (cont.)
Results by Location - actual, based on ownership period(1)
As of March 31, | |||||||||||||||||||||||||||||||||||||||||||||||||||||||||||||||||||||||
| 2025 | 2024 | Quarter ended March 31, 2025 | Quarter ended March 31, 2024 | ||||||||||||||||||||||||||||||||||||||||||||||||||||||||||||||||||||
| Location | No. of Properties | No. of Properties | Average Room Rate | Average Occupancy Percentage | RevPAR | Total RevPAR | Average Room Rate | Average Occupancy Percentage | RevPAR | Total RevPAR | Percent Change in RevPAR | Percent Change in Total RevPAR | |||||||||||||||||||||||||||||||||||||||||||||||||||||||||||
| Miami | 2 | 2 | $ | 652.77 | 84.1 | % | $ | 548.88 | $ | 921.13 | $ | 635.30 | 82.0 | % | $ | 520.71 | $ | 867.57 | 5.4 | % | 6.2 | % | |||||||||||||||||||||||||||||||||||||||||||||||||
| Florida Gulf Coast | 5 | 5 | 626.09 | 69.5 | % | 434.83 | 913.78 | 604.37 | 80.9 | % | 488.72 | 983.10 | (11.0 | %) | (7.1 | %) | |||||||||||||||||||||||||||||||||||||||||||||||||||||||
| Maui | 3 | 3 | 683.78 | 75.0 | % | 513.04 | 788.61 | 672.67 | 65.8 | % | 442.71 | 738.07 | 15.9 | % | 6.8 | % | |||||||||||||||||||||||||||||||||||||||||||||||||||||||
| Phoenix | 3 | 3 | 500.68 | 81.3 | % | 407.28 | 890.19 | 490.11 | 81.3 | % | 398.36 | 854.54 | 2.2 | % | 4.2 | % | |||||||||||||||||||||||||||||||||||||||||||||||||||||||
| Oahu | 2 | 1 | 483.66 | 83.8 | % | 405.20 | 625.53 | 208.11 | 97.6 | % | 203.11 | 236.24 | 99.5 | % | 164.8 | % | |||||||||||||||||||||||||||||||||||||||||||||||||||||||
| Jacksonville | 1 | 1 | 524.64 | 68.0 | % | 356.95 | 828.70 | 528.66 | 64.6 | % | 341.31 | 774.19 | 4.6 | % | 7.0 | % | |||||||||||||||||||||||||||||||||||||||||||||||||||||||
| Orlando | 2 | 2 | 435.81 | 73.3 | % | 319.65 | 660.15 | 407.08 | 74.2 | % | 302.14 | 637.59 | 5.8 | % | 3.5 | % | |||||||||||||||||||||||||||||||||||||||||||||||||||||||
| Nashville | 2 | — | 324.92 | 80.4 | % | 261.13 | 451.22 | — | — | % | — | — | — | % | — | % | |||||||||||||||||||||||||||||||||||||||||||||||||||||||
| New York | 3 | 2 | 327.97 | 79.0 | % | 258.99 | 382.34 | 289.59 | 74.0 | % | 214.29 | 317.47 | 20.9 | % | 20.4 | % | |||||||||||||||||||||||||||||||||||||||||||||||||||||||
| Los Angeles/Orange County | 3 | 3 | 311.12 | 79.2 | % | 246.38 | 368.36 | 299.02 | 74.8 | % | 223.80 | 334.70 | 10.1 | % | 10.1 | % | |||||||||||||||||||||||||||||||||||||||||||||||||||||||
| Washington, D.C. (CBD) | 5 | 5 | 328.11 | 68.0 | % | 223.24 | 322.78 | 275.83 | 66.9 | % | 184.43 | 270.75 | 21.0 | % | 19.2 | % | |||||||||||||||||||||||||||||||||||||||||||||||||||||||
| San Diego | 3 | 3 | 301.96 | 72.7 | % | 219.60 | 433.52 | 294.27 | 77.4 | % | 227.67 | 452.71 | (3.5 | %) | (4.2 | %) | |||||||||||||||||||||||||||||||||||||||||||||||||||||||
| San Francisco/San Jose | 6 | 6 | 300.24 | 63.6 | % | 191.05 | 285.73 | 290.06 | 64.0 | % | 185.67 | 280.40 | 2.9 | % | 1.9 | % | |||||||||||||||||||||||||||||||||||||||||||||||||||||||
| New Orleans | 1 | 1 | 256.20 | 71.4 | % | 182.91 | 278.00 | 211.33 | 74.6 | % | 157.65 | 253.56 | 16.0 | % | 9.6 | % | |||||||||||||||||||||||||||||||||||||||||||||||||||||||
| Austin | 2 | 2 | 267.21 | 67.4 | % | 180.05 | 324.90 | 276.13 | 64.7 | % | 178.72 | 323.83 | 0.7 | % | 0.3 | % | |||||||||||||||||||||||||||||||||||||||||||||||||||||||
| Northern Virginia | 2 | 2 | 271.39 | 65.4 | % | 177.61 | 289.32 | 244.11 | 67.8 | % | 165.55 | 265.89 | 7.3 | % | 8.8 | % | |||||||||||||||||||||||||||||||||||||||||||||||||||||||
| Philadelphia | 2 | 2 | 217.69 | 76.8 | % | 167.08 | 260.44 | 202.76 | 72.8 | % | 147.59 | 228.90 | 13.2 | % | 13.8 | % | |||||||||||||||||||||||||||||||||||||||||||||||||||||||
| Houston | 5 | 5 | 232.08 | 71.7 | % | 166.43 | 238.70 | 223.14 | 74.6 | % | 166.45 | 231.31 | — | % | 3.2 | % | |||||||||||||||||||||||||||||||||||||||||||||||||||||||
| Boston | 2 | 2 | 235.02 | 64.9 | % | 152.52 | 223.00 | 224.11 | 67.9 | % | 152.09 | 221.78 | 0.3 | % | 0.6 | % | |||||||||||||||||||||||||||||||||||||||||||||||||||||||
| San Antonio | 2 | 2 | 229.79 | 66.3 | % | 152.40 | 252.38 | 229.52 | 66.1 | % | 151.75 | 252.73 | 0.4 | % | (0.1 | %) | |||||||||||||||||||||||||||||||||||||||||||||||||||||||
| Atlanta | 2 | 2 | 222.74 | 67.3 | % | 149.83 | 256.93 | 213.56 | 61.6 | % | 131.66 | 227.78 | 13.8 | % | 12.8 | % | |||||||||||||||||||||||||||||||||||||||||||||||||||||||
| Seattle | 2 | 2 | 212.06 | 54.7 | % | 116.05 | 159.55 | 210.91 | 52.7 | % | 111.05 | 162.48 | 4.5 | % | (1.8 | %) | |||||||||||||||||||||||||||||||||||||||||||||||||||||||
| Denver | 3 | 3 | 183.68 | 55.6 | % | 102.11 | 159.71 | 177.37 | 55.3 | % | 98.05 | 159.53 | 4.1 | % | 0.1 | % | |||||||||||||||||||||||||||||||||||||||||||||||||||||||
| Chicago | 3 | 3 | 186.39 | 53.0 | % | 98.78 | 147.67 | 179.25 | 55.7 | % | 99.76 | 145.54 | (1.0 | %) | 1.5 | % | |||||||||||||||||||||||||||||||||||||||||||||||||||||||
| Other | 10 | 10 | 371.12 | 60.7 | % | 225.44 | 350.98 | 351.34 | 58.4 | % | 205.11 | 320.77 | 9.9 | % | 9.4 | % | |||||||||||||||||||||||||||||||||||||||||||||||||||||||
| Domestic | 76 | 72 | 352.99 | 69.3 | % | 244.68 | 417.24 | 329.69 | 69.1 | % | 227.73 | 393.64 | 7.4 | % | 6.0 | % | |||||||||||||||||||||||||||||||||||||||||||||||||||||||
| International | 5 | 5 | 172.01 | 61.0 | % | 104.88 | 136.91 | 173.64 | 56.1 | % | 97.47 | 139.44 | 7.6 | % | (1.8 | %) | |||||||||||||||||||||||||||||||||||||||||||||||||||||||
| All Locations | 81 | 77 | $ | 347.48 | 69.0 | % | $ | 239.86 | $ | 407.62 | $ | 325.14 | 68.6 | % | $ | 223.09 | $ | 384.62 | 7.5 | % | 6.0 | % | |||||||||||||||||||||||||||||||||||||||||||||||||
___________
(1)Represents the results of the portfolio for the time period of our ownership, including the results of non-comparable properties, dispositions through their date of disposal and acquisitions beginning as of the date of acquisition.
PAGE 10 OF 20
HOST HOTELS & RESORTS, INC.
Schedule of Comparable Hotel Results (1)
(unaudited, in millions, except hotel statistics)
| Quarter ended March 31, | |||||||||||
| 2025 | 2024 | ||||||||||
| Number of hotels | 79 | 79 | |||||||||
| Number of rooms | 42,982 | 42,982 | |||||||||
| Change in comparable hotel Total RevPAR | 5.8 | % | — | ||||||||
| Change in comparable hotel RevPAR | 7.0 | % | — | ||||||||
Operating profit margin⁽²⁾ | 17.9 | % | 19.8 | % | |||||||
Comparable hotel EBITDA margin⁽²⁾ | 31.8 | % | 31.5 | % | |||||||
| Food and beverage profit margin⁽²⁾ | 35.8 | % | 37.6 | % | |||||||
Comparable hotel food and beverage profit margin⁽²⁾ | 36.1 | % | 36.9 | % | |||||||
| Net income | $ | 251 | $ | 272 | |||||||
| Depreciation and amortization | 196 | 180 | |||||||||
| Interest expense | 57 | 47 | |||||||||
| Benefit for income taxes | (1) | (2) | |||||||||
| Gain on sale of property and corporate level income/expense | 9 | (20) | |||||||||
Property transaction adjustments⁽³⁾ | — | 19 | |||||||||
Non-comparable hotel results, net⁽⁴⁾ | (8) | (20) | |||||||||
Comparable hotel EBITDA⁽¹⁾ | $ | 504 | $ | 476 | |||||||
___________
(1)See the Notes to Financial Information for a discussion of comparable hotel results, which are non-GAAP measures, and the limitations on their use. For additional information on comparable hotel EBITDA by location, see the First Quarter 2025 Supplemental Financial Information posted on our website.
(2)Profit margins are calculated by dividing the applicable operating profit by the related revenue amount. GAAP profit margins are calculated using amounts presented in the unaudited condensed consolidated statements of operations. Comparable hotel margins are calculated using amounts presented in the following tables, which include reconciliations to the applicable GAAP results:
| Quarter ended March 31, 2025 | Quarter ended March 31, 2024 | ||||||||||||||||||||||||||||||||||||||||||||||||||||
| Adjustments | Adjustments | ||||||||||||||||||||||||||||||||||||||||||||||||||||
| GAAP Results | Non-comparable hotel results, net ⁽⁴⁾ | Depreciation and corporate level items | Comparable hotel Results | GAAP Results | Property transaction adjustments (3) | Non-comparable hotel results, net ⁽⁴⁾ | Depreciation and corporate level items | Comparable hotel Results | |||||||||||||||||||||||||||||||||||||||||||||
| Revenues | |||||||||||||||||||||||||||||||||||||||||||||||||||||
| Room | $ | 938 | $ | (7) | $ | — | $ | 931 | $ | 853 | $ | 44 | $ | (17) | $ | — | $ | 880 | |||||||||||||||||||||||||||||||||||
Food and beverage | 503 | (3) | — | 500 | 473 | 20 | (11) | — | 482 | ||||||||||||||||||||||||||||||||||||||||||||
| Other | 153 | (1) | — | 152 | 145 | 9 | (4) | — | 150 | ||||||||||||||||||||||||||||||||||||||||||||
| Total revenues | 1,594 | (11) | — | 1,583 | 1,471 | 73 | (32) | — | 1,512 | ||||||||||||||||||||||||||||||||||||||||||||
| Expenses | |||||||||||||||||||||||||||||||||||||||||||||||||||||
| Room | 225 | (2) | — | 223 | 202 | 11 | (3) | — | 210 | ||||||||||||||||||||||||||||||||||||||||||||
Food and beverage | 323 | (3) | — | 320 | 295 | 16 | (7) | — | 304 | ||||||||||||||||||||||||||||||||||||||||||||
| Other | 544 | (8) | — | 536 | 507 | 27 | (12) | — | 522 | ||||||||||||||||||||||||||||||||||||||||||||
Depreciation and amortization | 196 | — | (196) | — | 180 | — | — | (180) | — | ||||||||||||||||||||||||||||||||||||||||||||
Corporate and other expenses | 31 | — | (31) | — | 27 | — | — | (27) | — | ||||||||||||||||||||||||||||||||||||||||||||
| Net gain on insurance settlements | (10) | 10 | — | — | (31) | — | 10 | 21 | — | ||||||||||||||||||||||||||||||||||||||||||||
| Total expenses | 1,309 | (3) | (227) | 1,079 | 1,180 | 54 | (12) | (186) | 1,036 | ||||||||||||||||||||||||||||||||||||||||||||
| Operating Profit - Comparable hotel EBITDA | $ | 285 | $ | (8) | $ | 227 | $ | 504 | $ | 291 | $ | 19 | $ | (20) | $ | 186 | $ | 476 | |||||||||||||||||||||||||||||||||||
(3)Property transaction adjustments represent the following items: (i) the elimination of results of operations of hotels sold or held-for-sale as of the reporting date, which operations are included in our unaudited condensed consolidated statements of operations as continuing operations, and (ii) the addition of results for periods prior to our ownership for hotels acquired as of the reporting date.
(4)Non-comparable hotel results, net, includes the following items: (i) the results of operations of our non-comparable hotels, which operations are included in our condensed consolidated statements of operations as continuing operations, and (ii) gains on business interruption proceeds covering lost revenues while the property was considered non-comparable.
PAGE 11 OF 20
HOST HOTELS & RESORTS, INC.
Reconciliation of Net Income to
EBITDA, EBITDAre and Adjusted EBITDAre (1)
(unaudited, in millions)
| Quarter ended March 31, | |||||||||||
| 2025 | 2024 | ||||||||||
| Net income⁽²⁾ | $ | 251 | $ | 272 | |||||||
| Interest expense | 57 | 47 | |||||||||
| Depreciation and amortization | 196 | 180 | |||||||||
| Income taxes | (1) | (2) | |||||||||
| EBITDA⁽²⁾ | 503 | 497 | |||||||||
| Equity investment adjustments: | |||||||||||
| Equity in earnings of affiliates | (10) | (8) | |||||||||
| Pro rata EBITDAre of equity investments⁽³⁾ | 15 | 15 | |||||||||
| EBITDAre⁽²⁾ | 508 | 504 | |||||||||
Adjustments to EBITDAre: | |||||||||||
| Net gain on property insurance settlements | — | (21) | |||||||||
| Non-cash stock-based compensation expense⁽⁴⁾ | 6 | 6 | |||||||||
| Adjusted EBITDAre⁽²⁾ | $ | 514 | $ | 489 | |||||||
___________
(1)See the Notes to Financial Information for discussion of non-GAAP measures.
(2)Net income, EBITDA, EBITDAre, Adjusted EBITDAre, NAREIT FFO and Adjusted FFO for the quarter ended March 31, 2025 include a gain of $4 million from the sale of land adjacent to The Phoenician hotel.
(3)Unrealized gains of our unconsolidated investments are not recognized in our EBITDAre, Adjusted EBITDAre, NAREIT FFO or Adjusted FFO until they have been realized by the unconsolidated partnership.
(4)Effective January 1, 2025, we exclude the expense recorded for non-cash stock-based compensation, as it represents a non-cash transaction and the add back is consistent with the calculation of Adjusted EBITDA for our financial covenant ratios. Prior year results have been updated to conform with the current year presentation. See the Notes to Financial Information for more information on this change.
PAGE 12 OF 20
HOST HOTELS & RESORTS, INC.
Reconciliation of Diluted Earnings per Common Share to
NAREIT and Adjusted Funds From Operations per Diluted Share (1)
(unaudited, in millions, except per share amounts)
| Quarter ended March 31, | |||||||||||
| 2025 | 2024 | ||||||||||
| Net income⁽²⁾ | $ | 251 | $ | 272 | |||||||
| Less: Net income attributable to non-controlling interests | (3) | (4) | |||||||||
| Net income attributable to Host Inc. | 248 | 268 | |||||||||
| Adjustments: | |||||||||||
| Net gain on property insurance settlements | — | (21) | |||||||||
| Depreciation and amortization | 195 | 180 | |||||||||
| Equity investment adjustments: | |||||||||||
| Equity in earnings of affiliates | (10) | (8) | |||||||||
| Pro rata FFO of equity investments⁽³⁾ | 10 | 9 | |||||||||
| Consolidated partnership adjustments: | |||||||||||
| FFO adjustments for non-controlling interests of Host L.P. | (3) | (2) | |||||||||
| NAREIT FFO⁽²⁾ | 440 | 426 | |||||||||
| Adjustments to NAREIT FFO: | |||||||||||
| Non-cash stock-based compensation expense⁽⁴⁾ | 6 | 6 | |||||||||
| Adjusted FFO⁽²⁾ | $ | 446 | $ | 432 | |||||||
| For calculation on a per share basis:⁽⁵⁾ | |||||||||||
| Diluted weighted average shares outstanding - EPS, NAREIT FFO and Adjusted FFO | 698.3 | 705.5 | |||||||||
| Diluted earnings per common share | $ | 0.35 | $ | 0.38 | |||||||
| NAREIT FFO per diluted share | $ | 0.63 | $ | 0.60 | |||||||
| Adjusted FFO per diluted share | $ | 0.64 | $ | 0.61 | |||||||
___________
(1-4)Refer to the corresponding footnote on the Reconciliation of Net Income to EBITDA, EBITDAre and Adjusted EBITDAre.
(5)Diluted earnings per common share, NAREIT FFO per diluted share and Adjusted FFO per diluted share are adjusted for the effects of dilutive securities. Dilutive securities may include shares granted under comprehensive stock plans, preferred OP units held by non-controlling limited partners and other non-controlling interests that have the option to convert their limited partner interests to common OP units. No effect is shown for securities if they are anti-dilutive.
PAGE 13 OF 20
HOST HOTELS & RESORTS, INC.
Reconciliation of Net Income to
EBITDA, EBITDAre and Adjusted EBITDAre and Diluted Earnings per Common Share to
NAREIT and Adjusted Funds From Operations per Diluted Share for Full Year 2025 Forecasts (1)(2)
(unaudited, in millions)
Full Year 2025 | |||||||||||
| Low-end of range | High-end of range | ||||||||||
| Net income | $ | 512 | $ | 581 | |||||||
| Interest expense | 237 | 237 | |||||||||
| Depreciation and amortization | 784 | 784 | |||||||||
| Income taxes | 23 | 24 | |||||||||
| EBITDA | 1,556 | 1,626 | |||||||||
| Equity investment adjustments: | |||||||||||
| Equity in earnings of affiliates | (14) | (15) | |||||||||
| Pro rata EBITDAre of equity investments | 44 | 45 | |||||||||
| EBITDAre | 1,586 | 1,656 | |||||||||
| Adjustments to EBITDAre: | |||||||||||
| Non-cash stock-based compensation expense ⁽²⁾ | 24 | 24 | |||||||||
| Adjusted EBITDAre | $ | 1,610 | $ | 1,680 | |||||||
Full Year 2025 | |||||||||||
| Low-end of range | High-end of range | ||||||||||
| Net income | $ | 512 | $ | 581 | |||||||
| Less: Net income attributable to non-controlling interests | (8) | (9) | |||||||||
| Net income attributable to Host Inc. | 504 | 572 | |||||||||
| Adjustments: | |||||||||||
| Depreciation and amortization | 782 | 782 | |||||||||
| Equity investment adjustments: | |||||||||||
| Equity in earnings of affiliates | (14) | (15) | |||||||||
| Pro rata FFO of equity investments | 23 | 24 | |||||||||
| Consolidated partnership adjustments: | |||||||||||
| FFO adjustment for non-controlling partnerships | (1) | (1) | |||||||||
| FFO adjustment for non-controlling interests of Host LP | (11) | (11) | |||||||||
| NAREIT FFO | 1,283 | 1,351 | |||||||||
| Adjustments to NAREIT FFO: | |||||||||||
| Non-cash stock-based compensation expense ⁽²⁾ | 24 | 24 | |||||||||
| Adjusted FFO | $ | 1,307 | $ | 1,375 | |||||||
| Diluted weighted average shares outstanding - EPS, NAREIT FFO and Adjusted FFO | 696.5 | 696.5 | |||||||||
| Diluted earnings per common share | $ | 0.72 | $ | 0.82 | |||||||
| NAREIT FFO per diluted share | $ | 1.84 | $ | 1.94 | |||||||
| Adjusted FFO per diluted share | $ | 1.88 | $ | 1.97 | |||||||
_______________
(1)The Forecasts are based on the below assumptions:
•Comparable hotel RevPAR will increase 0.5% to 2.5% compared to 2024 for the low and high end of the forecast range. This forecast assumes a moderate recovery at our Maui properties, however the timing of Maui's full recovery remains uncertain.
•Comparable hotel EBITDA margins will decrease 160 basis points to 100 basis points compared to 2024 for the low and high ends of the forecasted comparable hotel RevPAR range, respectively.
•We expect to spend approximately $580 million to $670 million on capital expenditures.
•Assumes no acquisitions or dispositions during the year.
•Assumes no additional gain from insurance settlements related to the hurricane claim as timing remains uncertain.
For a discussion of items that may affect forecast results, see the Notes to Financial Information.
(2) Effective January 1, 2025, we exclude the expense recorded for non-cash stock-based compensation from our presentation of Adjusted EBITDAre and Adjusted FFO per diluted share. In 2024, this amount totaled $24 million.
PAGE 14 OF 20
HOST HOTELS & RESORTS, INC.
Schedule of Comparable Hotel Results for Full Year 2025 Forecasts (1)(2)
(unaudited, in millions)
Full Year 2025 | |||||||||||
| Low-end of range | High-end of range | ||||||||||
Operating profit margin(3) | 12.2 | % | 13.1 | % | |||||||
Comparable hotel EBITDA margin(3) | 27.7 | % | 28.3 | % | |||||||
| Net income | $ | 512 | $ | 581 | |||||||
| Depreciation and amortization | 784 | 784 | |||||||||
| Interest expense | 237 | 237 | |||||||||
| Provision for income taxes | 23 | 24 | |||||||||
| Gain on sale of property and corporate level income/expense | 79 | 79 | |||||||||
Non-comparable hotel results, net(4) | (21) | (23) | |||||||||
Condominium sales (5) | (21) | (21) | |||||||||
Comparable hotel EBITDA(1) | $ | 1,593 | $ | 1,661 | |||||||
___________
(1)See "Reconciliation of Net Income to EBITDA, EBITDAre and Adjusted EBITDAre and Diluted Earnings per Common Share to NAREIT and Adjusted Funds From Operations per Diluted Share for Full Year 2025 Forecasts" for other forecast assumptions.
(2)Forecast comparable hotel results include 79 hotels (of our 81 hotels owned at March 31, 2025) that we have assumed will be classified as comparable as of December 31, 2025. See footnote (4) for details on our non-comparable hotel results.
(3)Profit margins are calculated by dividing the applicable operating profit by the related revenue amount. GAAP profit margins are calculated using amounts presented in the unaudited condensed consolidated statements of operations. Comparable hotel margins are calculated using amounts presented in the following tables, which include reconciliations to the applicable GAAP results:
| Low-end of range | High-end of range | ||||||||||||||||||||||||||||||||||||||||||||||||||||||||||
| Adjustments | Adjustments | ||||||||||||||||||||||||||||||||||||||||||||||||||||||||||
| GAAP Results | Non-comparable hotel results, net | Condominium sales | Depreciation and corporate level items | Comparable hotel Results | GAAP Results | Non-comparable hotel results, net | Condominium sales | Depreciation and corporate level items | Comparable hotel Results | ||||||||||||||||||||||||||||||||||||||||||||||||||
| Revenues | |||||||||||||||||||||||||||||||||||||||||||||||||||||||||||
| Rooms | $ | 3,514 | $ | (47) | $ | — | $ | — | $ | 3,467 | $ | 3,586 | $ | (49) | $ | — | $ | — | $ | 3,537 | |||||||||||||||||||||||||||||||||||||||
| Food and beverage | 1,746 | (18) | — | — | 1,728 | 1,780 | (19) | — | — | 1,761 | |||||||||||||||||||||||||||||||||||||||||||||||||
| Other | 727 | (11) | (153) | — | 563 | 738 | (11) | (153) | — | 574 | |||||||||||||||||||||||||||||||||||||||||||||||||
| Total revenues | 5,987 | (76) | (153) | — | 5,758 | 6,104 | (79) | (153) | — | 5,872 | |||||||||||||||||||||||||||||||||||||||||||||||||
| Expenses | |||||||||||||||||||||||||||||||||||||||||||||||||||||||||||
| Hotel expenses | 4,362 | (65) | (132) | — | 4,165 | 4,409 | (66) | (132) | — | 4,211 | |||||||||||||||||||||||||||||||||||||||||||||||||
| Depreciation and amortization | 784 | — | — | (784) | — | 784 | — | — | (784) | — | |||||||||||||||||||||||||||||||||||||||||||||||||
| Corporate and other expenses | 122 | — | — | (122) | — | 123 | — | — | (123) | — | |||||||||||||||||||||||||||||||||||||||||||||||||
| Net gain on insurance settlements | (10) | 10 | — | — | — | (10) | 10 | — | — | — | |||||||||||||||||||||||||||||||||||||||||||||||||
| Total expenses | 5,258 | (55) | (132) | (906) | 4,165 | 5,306 | (56) | (132) | (907) | 4,211 | |||||||||||||||||||||||||||||||||||||||||||||||||
| Operating Profit - Comparable hotel EBITDA | $ | 729 | $ | (21) | $ | (21) | $ | 906 | $ | 1,593 | $ | 798 | $ | (23) | $ | (21) | $ | 907 | $ | 1,661 | |||||||||||||||||||||||||||||||||||||||
(4)Non-comparable hotel results, net, includes the following items: (i) the results of operations of our non-comparable hotels, which operations are included in our condensed consolidated statements of operations as continuing operations, and (ii) gains on business interruption proceeds covering lost revenues while the property was considered non-comparable. The following are expected to be non-comparable for full year 2025:
•Alila Ventana Big Sur (business disruption due to the collapse of a portion of Highway 1, causing closure of the hotel beginning in March 2024, reopened in May 2024); and
•The Don CeSar (business disruption due to Hurricane Helene resulting in closure of the hotel beginning at the end of September 2024, reopened in March 2025).
(5) Includes revenues and costs, including marketing expenses of approximately $4 million, related to the development and sale of condominium units at the Four Seasons Resort Orlando at Walt Disney World® Resort.
PAGE 15 OF 20
HOST HOTELS & RESORTS, INC.
Notes to Financial Information
FORECASTS
Our forecast of net income, earnings per diluted share, NAREIT and Adjusted FFO per diluted share, EBITDA, EBITDAre, Adjusted EBITDAre and comparable hotel results are forward-looking statements and are not guarantees of future performance and involve known and unknown risks, uncertainties and other factors which may cause actual results and performance to differ materially from those expressed or implied by these forecasts. Although we believe the expectations reflected in the forecasts are based upon reasonable assumptions, we can give no assurance that the expectations will be attained or that the results will not be materially different. Risks that may affect these assumptions and forecasts include the following: potential changes in overall economic outlook make it inherently difficult to forecast the level of RevPAR; the amount and timing of debt payments may change significantly based on market conditions, which will directly affect the level of interest expense and net income; the amount and timing of transactions involving shares of our common stock may change based on market conditions; and other risks and uncertainties associated with our business described herein and in our annual report on Form 10-K, quarterly reports on Form 10-Q and current reports on Form 8-K filed with the SEC.
COMPARABLE HOTEL OPERATING STATISTICS AND RESULTS
To facilitate a year-to-year comparison of our operations, we present certain operating statistics (i.e., Total RevPAR, RevPAR, average daily rate and average occupancy) and operating results (revenues, expenses, hotel EBITDA and associated margins) for the periods included in our reports on a comparable hotel basis in order to enable our investors to better evaluate our operating performance. We define our comparable hotels as those that: (i) are owned or leased by us as of the reporting date and are not classified as held-for-sale; and (ii) have not sustained substantial property damage or business interruption, or undergone large-scale capital projects, in each case requiring closures lasting one month or longer (as further defined below), during the reporting periods being compared.
We make adjustments to include recent acquisitions to include results for periods prior to our ownership. For these hotels, since the year-over-year comparison includes periods prior to our ownership, the changes will not necessarily correspond to changes in our actual results. Additionally, operating results of hotels that we sell are excluded from the comparable hotel set once the transaction has closed or the hotel is classified as held-for-sale.
The hotel business is capital-intensive and renovations are a regular part of the business. Generally, hotels under renovation remain comparable hotels. A large-scale capital project would cause a hotel to be excluded from our comparable hotel set if it requires the entire property to be closed to hotel guests for one month or longer.
Similarly, hotels are excluded from our comparable hotel set from the date that they sustain substantial property damage or business interruption if it requires the property to be closed to hotel guests for one month or longer. In each case, these hotels are returned to the comparable hotel set when the operations of the hotel have been included in our consolidated results for one full calendar year after the hotel has reopened. Often, related to events that cause property damage and the closure of a hotel, we will collect business interruption insurance proceeds for the near-term loss of business. These proceeds are included in net gain on insurance settlements on our condensed consolidated statements of operations. Business interruption insurance gains covering lost revenues while the property was considered non-comparable also will be excluded from the comparable hotel results.
Of the 81 hotels that we owned as of March 31, 2025, 79 have been classified as comparable hotels. The operating results of the following properties that we owned as of March 31, 2025 are excluded from comparable hotel results for these periods:
•The Don CeSar (business disruption due to Hurricane Helene resulting in closure of the hotel beginning at the end of September 2024, reopened in March 2025);
•Alila Ventana Big Sur (business disruption due to the collapse of a portion of Highway 1, causing closure of the hotel beginning in March 2024, reopened in May 2024); and
•Sales and marketing expenses related to the development and sale of condominium units on a development parcel adjacent to Four Seasons Resort Orlando at Walt Disney World® Resort.
FOREIGN CURRENCY TRANSLATION
Operating results denominated in foreign currencies are translated using the prevailing exchange rates on the date of the transaction, or monthly based on the weighted average exchange rate for the period. Therefore, hotel statistics and results for non-U.S. properties include the effect of currency fluctuations, consistent with our financial statement presentation.
NON-GAAP FINANCIAL MEASURES
Included in this press release are certain “non-GAAP financial measures,” which are measures of our historical or future financial performance that are not calculated and presented in accordance with GAAP, within the meaning of applicable SEC rules. They are as follows: (i) FFO and FFO per diluted share (both NAREIT and Adjusted), (ii) EBITDA, (iii) EBITDAre and Adjusted EBITDAre, and (iv) Comparable Hotel Operating Statistics and Results. The following discussion defines these measures and presents why we believe they are useful supplemental measures of our performance.
PAGE 16 OF 20
HOST HOTELS & RESORTS, INC.
Notes to Financial Information (cont.)
NAREIT FFO AND NAREIT FFO PER DILUTED SHARE
We present NAREIT FFO and NAREIT FFO per diluted share as non-GAAP measures of our performance in addition to our earnings per share (calculated in accordance with GAAP). We calculate NAREIT FFO per diluted share as our NAREIT FFO (defined as set forth below) for a given operating period, as adjusted for the effect of dilutive securities, divided by the number of fully diluted shares outstanding during such period, in accordance with NAREIT guidelines. As noted in NAREIT’s Funds From Operations White Paper – 2018 Restatement, NAREIT defines FFO as net income (calculated in accordance with GAAP) excluding depreciation and amortization related to certain real estate assets, gains and losses from the sale of certain real estate assets, gains and losses from change in control, impairment expense of certain real estate assets and investments and adjustments for consolidated partially owned entities and unconsolidated affiliates. Adjustments for consolidated partially owned entities and unconsolidated affiliates are calculated to reflect our pro rata share of the FFO of those entities on the same basis.
We believe that NAREIT FFO per diluted share is a useful supplemental measure of our operating performance and that the presentation of NAREIT FFO per diluted share, when combined with the primary GAAP presentation of diluted earnings per share, provides beneficial information to investors. By excluding the effect of real estate depreciation, amortization, impairment expense and gains and losses from sales of depreciable real estate, all of which are based on historical cost accounting and which may be of lesser significance in evaluating current performance, we believe that such measures can facilitate comparisons of operating performance between periods and with other REITs, even though NAREIT FFO per diluted share does not represent an amount that accrues directly to holders of our common stock. Historical cost accounting for real estate assets implicitly assumes that the value of real estate assets diminishes predictably over time. As noted by NAREIT in its Funds From Operations White Paper – 2018 Restatement, the primary purpose for including FFO as a supplemental measure of operating performance of a REIT is to address the artificial nature of historical cost depreciation and amortization of real estate and real estate-related assets mandated by GAAP. For these reasons, NAREIT adopted the FFO metric in order to promote a uniform industry-wide measure of REIT operating performance.
Adjusted FFO per Diluted Share
We also present Adjusted FFO per diluted share when evaluating our performance because management believes that the exclusion of certain additional items described below provides useful supplemental information to investors regarding our ongoing operating performance. Management historically has made the adjustments detailed below in evaluating our performance, in our annual budget process and for our compensation programs. We believe that the presentation of Adjusted FFO per diluted share, when combined with both the primary GAAP presentation of diluted earnings per share and FFO per diluted share as defined by NAREIT, provides useful supplemental information that is beneficial to an investor’s understanding of our operating performance. We adjust NAREIT FFO per diluted share for the following items, which may occur in any period, and refer to this measure as Adjusted FFO per diluted share:
•Gains and Losses on the Extinguishment of Debt – We exclude the effect of finance charges and premiums associated with the extinguishment of debt, including the acceleration of the write-off of deferred financing costs from the original issuance of the debt being redeemed or retired and incremental interest expense incurred during the refinancing period. We also exclude the gains on debt repurchases and the original issuance costs associated with the retirement of preferred stock. We believe that these items are not reflective of our ongoing finance costs.
•Acquisition Costs – Under GAAP, costs associated with completed property acquisitions that are considered business combinations are expensed in the year incurred. We exclude the effect of these costs because we believe they are not reflective of the ongoing performance of the Company.
•Litigation Gains and Losses – We exclude the effect of gains or losses associated with litigation recorded under GAAP that we consider to be outside the ordinary course of business. We believe that including these items is not consistent with our ongoing operating performance.
•Severance Expense – In certain circumstances, we will add back hotel-level severance expenses when we do not believe that such expenses are reflective of the ongoing operation of our properties. Situations that would result in a severance add-back include, but are not limited to, (i) costs incurred as part of a broad-based reconfiguration of the operating model with the specific hotel operator for a portfolio of hotels and (ii) costs incurred at a specific hotel due to a broad-based and significant reconfiguration of a hotel and/or its workforce. We do not add back corporate-level severance costs or severance costs at an individual hotel that we consider to be incurred in the normal course of business.
•Effective January 1, 2025, we exclude the expense recorded for non-cash stock-based compensation, as it represents a non-cash transaction and the add back is consistent with the calculation of Adjusted EBITDA for our financial covenant ratios under our credit facility and senior notes indentures and consistent with the presentation of Adjusted FFO per diluted share for the majority of other lodging REIT filers.
In unusual circumstances, we also may adjust NAREIT FFO for gains or losses that management believes are not representative of the Company’s current operating performance. For example, in 2017, as a result of the reduction of the U.S. federal corporate income tax rate from 35% to 21% by the Tax Cuts and Jobs Act, we remeasured our domestic deferred tax assets as of December 31,
PAGE 17 OF 20
HOST HOTELS & RESORTS, INC.
Notes to Financial Information (cont.)
2017 and recorded a one-time adjustment to reduce our deferred tax assets and to increase the provision for income taxes by approximately $11 million. We do not consider this adjustment to be reflective of our ongoing operating performance and, therefore, we excluded this item from Adjusted FFO.
EBITDA
Earnings before Interest Expense, Income Taxes, Depreciation and Amortization (“EBITDA”) is a commonly used measure of performance in many industries. Management believes EBITDA provides useful information to investors regarding our results of operations because it helps us and our investors evaluate the ongoing operating performance of our properties after removing the impact of the Company’s capital structure (primarily interest expense) and its asset base (primarily depreciation and amortization). Management also believes the use of EBITDA facilitates comparisons between us and other lodging REITs, hotel owners that are not REITs and other capital-intensive companies. Management uses EBITDA to evaluate property-level results and as one measure in determining the value of acquisitions and dispositions and, like FFO and Adjusted FFO per diluted share, it is widely used by management in the annual budget process and for our compensation programs.
EBITDAre and Adjusted EBITDAre
We present EBITDAre in accordance with NAREIT guidelines, as defined in its September 2017 white paper “Earnings Before Interest, Taxes, Depreciation and Amortization for Real Estate,” to provide an additional performance measure to facilitate the evaluation and comparison of the Company’s results with other REITs. NAREIT defines EBITDAre as net income (calculated in accordance with GAAP) excluding interest expense, income tax, depreciation and amortization, gains or losses on disposition of depreciated property (including gains or losses on change of control), impairment expense for depreciated property and of investments in unconsolidated affiliates caused by a decrease in value of depreciated property in the affiliate, and adjustments to reflect the entity’s pro rata share of EBITDAre of unconsolidated affiliates.
We make additional adjustments to EBITDAre when evaluating our performance because we believe that the exclusion of certain additional items described below provides useful supplemental information to investors regarding our ongoing operating performance. We believe that the presentation of Adjusted EBITDAre, when combined with the primary GAAP presentation of net income, is beneficial to an investor’s understanding of our operating performance. Adjusted EBITDAre also is similar to the measure used to calculate certain credit ratios for our credit facility and senior notes. We adjust EBITDAre for the following items, which may occur in any period, and refer to this measure as Adjusted EBITDAre:
•Property Insurance Gains and Property Damage Losses – We exclude the effect of property insurance gains reflected in our condensed consolidated statements of operations because we believe that including them in Adjusted EBITDAre is not consistent with reflecting the ongoing performance of our assets. In addition, property insurance gains could be less important to investors given that the depreciated asset book value written off in connection with the calculation of the property insurance gain often does not reflect the market value of real estate assets. Similarly, losses from property damage or remediation costs that are not covered through insurance are excluded.
•Acquisition Costs – Under GAAP, costs associated with completed property acquisitions that are considered business combinations are expensed in the year incurred. We exclude the effect of these costs because we believe they are not reflective of the ongoing performance of the Company.
•Litigation Gains and Losses – We exclude the effect of gains or losses associated with litigation recorded under GAAP that we consider to be outside the ordinary course of business. We believe that including these items is not consistent with our ongoing operating performance.
•Severance Expense – In certain circumstances, we will add back hotel-level severance expenses when we do not believe that such expenses are reflective of the ongoing operation of our properties. Situations that would result in a severance add-back include, but are not limited to, (i) costs incurred as part of a broad-based reconfiguration of the operating model with the specific hotel operator for a portfolio of hotels and (ii) costs incurred at a specific hotel due to a broad-based and significant reconfiguration of a hotel and/or its workforce. We do not add back corporate-level severance costs or severance costs at an individual hotel that we consider to be incurred in the normal course of business.
•Effective January 1, 2025, we exclude the expense recorded for non-cash stock-based compensation, as it represents a non-cash transaction and the add back is consistent with the calculation of Adjusted EBITDA for our financial covenant ratios under our credit facility and senior notes indentures and consistent with the presentation of Adjusted EBITDAre for the majority of other lodging REIT filers.
In unusual circumstances, we also may adjust EBITDAre for gains or losses that management believes are not representative of the Company’s current operating performance. The last adjustment of this nature was a 2013 exclusion of a gain from an eminent domain claim.
PAGE 18 OF 20
HOST HOTELS & RESORTS, INC.
Notes to Financial Information (cont.)
Limitations on the Use of NAREIT FFO per Diluted Share, Adjusted FFO per Diluted Share, EBITDA, EBITDAre and Adjusted EBITDAre
We calculate EBITDAre and NAREIT FFO per diluted share in accordance with standards established by NAREIT, which may not be comparable to measures calculated by other companies that do not use the NAREIT definition of EBITDAre and FFO or do not calculate FFO per diluted share in accordance with NAREIT guidance. In addition, although EBITDAre and FFO per diluted share are useful measures when comparing our results to other REITs, they may not be helpful to investors when comparing us to non-REITs. We also calculate Adjusted FFO per diluted share and Adjusted EBITDAre, which measures are not in accordance with NAREIT guidance and may not be comparable to measures calculated by other REITs or by other companies. This information should not be considered as an alternative to net income, operating profit, cash from operations or any other operating performance measure calculated in accordance with GAAP. Cash expenditures for various long-term assets (such as renewal and replacement capital expenditures), interest expense (for EBITDA, EBITDAre and Adjusted EBITDAre purposes only), severance expense related to significant property-level reconfiguration and other items have been, and will be, made and are not reflected in the EBITDA, EBITDAre, Adjusted EBITDAre, NAREIT FFO per diluted share and Adjusted FFO per diluted share presentations. Management compensates for these limitations by separately considering the impact of these excluded items to the extent they are material to operating decisions or assessments of our operating performance. Our consolidated statements of operations and consolidated statements of cash flows in the Company’s annual report on Form 10-K and quarterly reports on Form 10-Q include interest expense, capital expenditures, and other excluded items, all of which should be considered when evaluating our performance, as well as the usefulness of our non-GAAP financial measures. Additionally, NAREIT FFO per diluted share, Adjusted FFO per diluted share, EBITDA, EBITDAre and Adjusted EBITDAre should not be considered as measures of our liquidity or indicative of funds available to fund our cash needs, including our ability to make cash distributions. In addition, NAREIT FFO per diluted share and Adjusted FFO per diluted share do not measure, and should not be used as measures of, amounts that accrue directly to stockholders’ benefit.
Similarly, EBITDAre, Adjusted EBITDAre, NAREIT FFO and Adjusted FFO per diluted share include adjustments for the pro rata share of our equity investments, and NAREIT FFO and Adjusted FFO per diluted share include adjustments for the pro rata share of non-controlling partners in consolidated partnerships. Our equity investments consist of interests ranging from 11% to 67% in eight domestic and international partnerships that own a total of 42 properties and a vacation ownership development. Due to the voting rights of the outside owners, we do not control and, therefore, do not consolidate these entities. The non-controlling partners in consolidated partnerships primarily consist of the approximate 1% interest in Host LP held by unaffiliated limited partners and a 15% interest held by an unaffiliated limited partner in a partnership owning one hotel for which we do control the entity and, therefore, consolidate its operations. These pro rata results for NAREIT FFO and Adjusted FFO per diluted share, EBITDAre and Adjusted EBITDAre were calculated as set forth in the definitions above. Readers should be cautioned that the pro rata results presented in these measures for consolidated partnerships (for NAREIT FFO and Adjusted FFO per diluted share) and equity investments may not accurately depict the legal and economic implications of our investments in these entities.
Comparable Hotel Property Level Operating Results
We present certain operating results for our hotels, such as hotel revenues, expenses, food and beverage profit, and EBITDA (and the related margins), on a comparable hotel, or "same store," basis as supplemental information for our investors. Our comparable hotel results present operating results for our hotels without giving effect to dispositions or properties that experienced closures due to renovations or property damage, as discussed in “Comparable Hotel Operating Statistics and Results” above. We present comparable hotel EBITDA to help us and our investors evaluate the ongoing operating performance of our comparable hotels after removing the impact of the Company’s capital structure (primarily interest expense) and its asset base (primarily depreciation and amortization expense). Corporate-level costs and expenses also are removed to arrive at property-level results. We believe these property-level results provide investors with supplemental information about the ongoing operating performance of our comparable hotels. Comparable hotel results are presented both by location and for the Company’s properties in the aggregate. We eliminate from our comparable hotel level operating results severance costs related to broad-based and significant property-level reconfiguration that is not considered to be within the normal course of business, as we believe this elimination provides useful supplemental information that is beneficial to an investor’s understanding of our ongoing operating performance. We also eliminate depreciation and amortization expense because, even though depreciation and amortization expense are property-level expenses, these non-cash expenses, which are based on historical cost accounting for real estate assets, implicitly assume that the value of real estate assets diminishes predictably over time. As noted earlier, because real estate values historically have risen or fallen with market conditions, many real estate industry investors have considered presentation of historical cost accounting for operating results to be insufficient.
Because of the elimination of corporate-level costs and expenses, gains or losses on disposition, certain severance expenses and depreciation and amortization expense, the comparable hotel operating results we present do not represent our total revenues, expenses, operating profit or net income and should not be used to evaluate our performance as a whole. Management compensates for these limitations by separately considering the impact of these excluded items to the extent they are material to operating decisions or assessments of our operating performance. Our condensed consolidated statements of operations include such amounts, all of which should be considered by investors when evaluating our performance.
We present these hotel operating results on a comparable hotel basis because we believe that doing so provides investors and management with useful information for evaluating the period-to-period performance of our hotels and facilitates comparisons with other hotel REITs and hotel owners. In particular, these measures assist management and investors in distinguishing whether increases or decreases in revenues and/or expenses are due to growth or decline of operations at comparable hotels (which represent the vast majority of our portfolio) or from other factors. While management believes that presentation of comparable
PAGE 19 OF 20
HOST HOTELS & RESORTS, INC.
Notes to Financial Information (cont.)
hotel results is a supplemental measure that provides useful information in evaluating our ongoing performance, this measure is not used to allocate resources or to assess the operating performance of each of our hotels, as these decisions are based on data for individual hotels and are not based on comparable hotel results in the aggregate. For these reasons, we believe comparable hotel operating results, when combined with the presentation of GAAP operating profit, revenues and expenses, provide useful information to investors and management.
PAGE 20 OF 20